| Math 131 | Grinnell College | Fall, 2012 |
| Section 1: MWF 8:00-8:50, T 10:00-10:50 (Science 3821) Section 4: MTWF: 1:15-2:05 (Science 3821) |
Calculus I | |
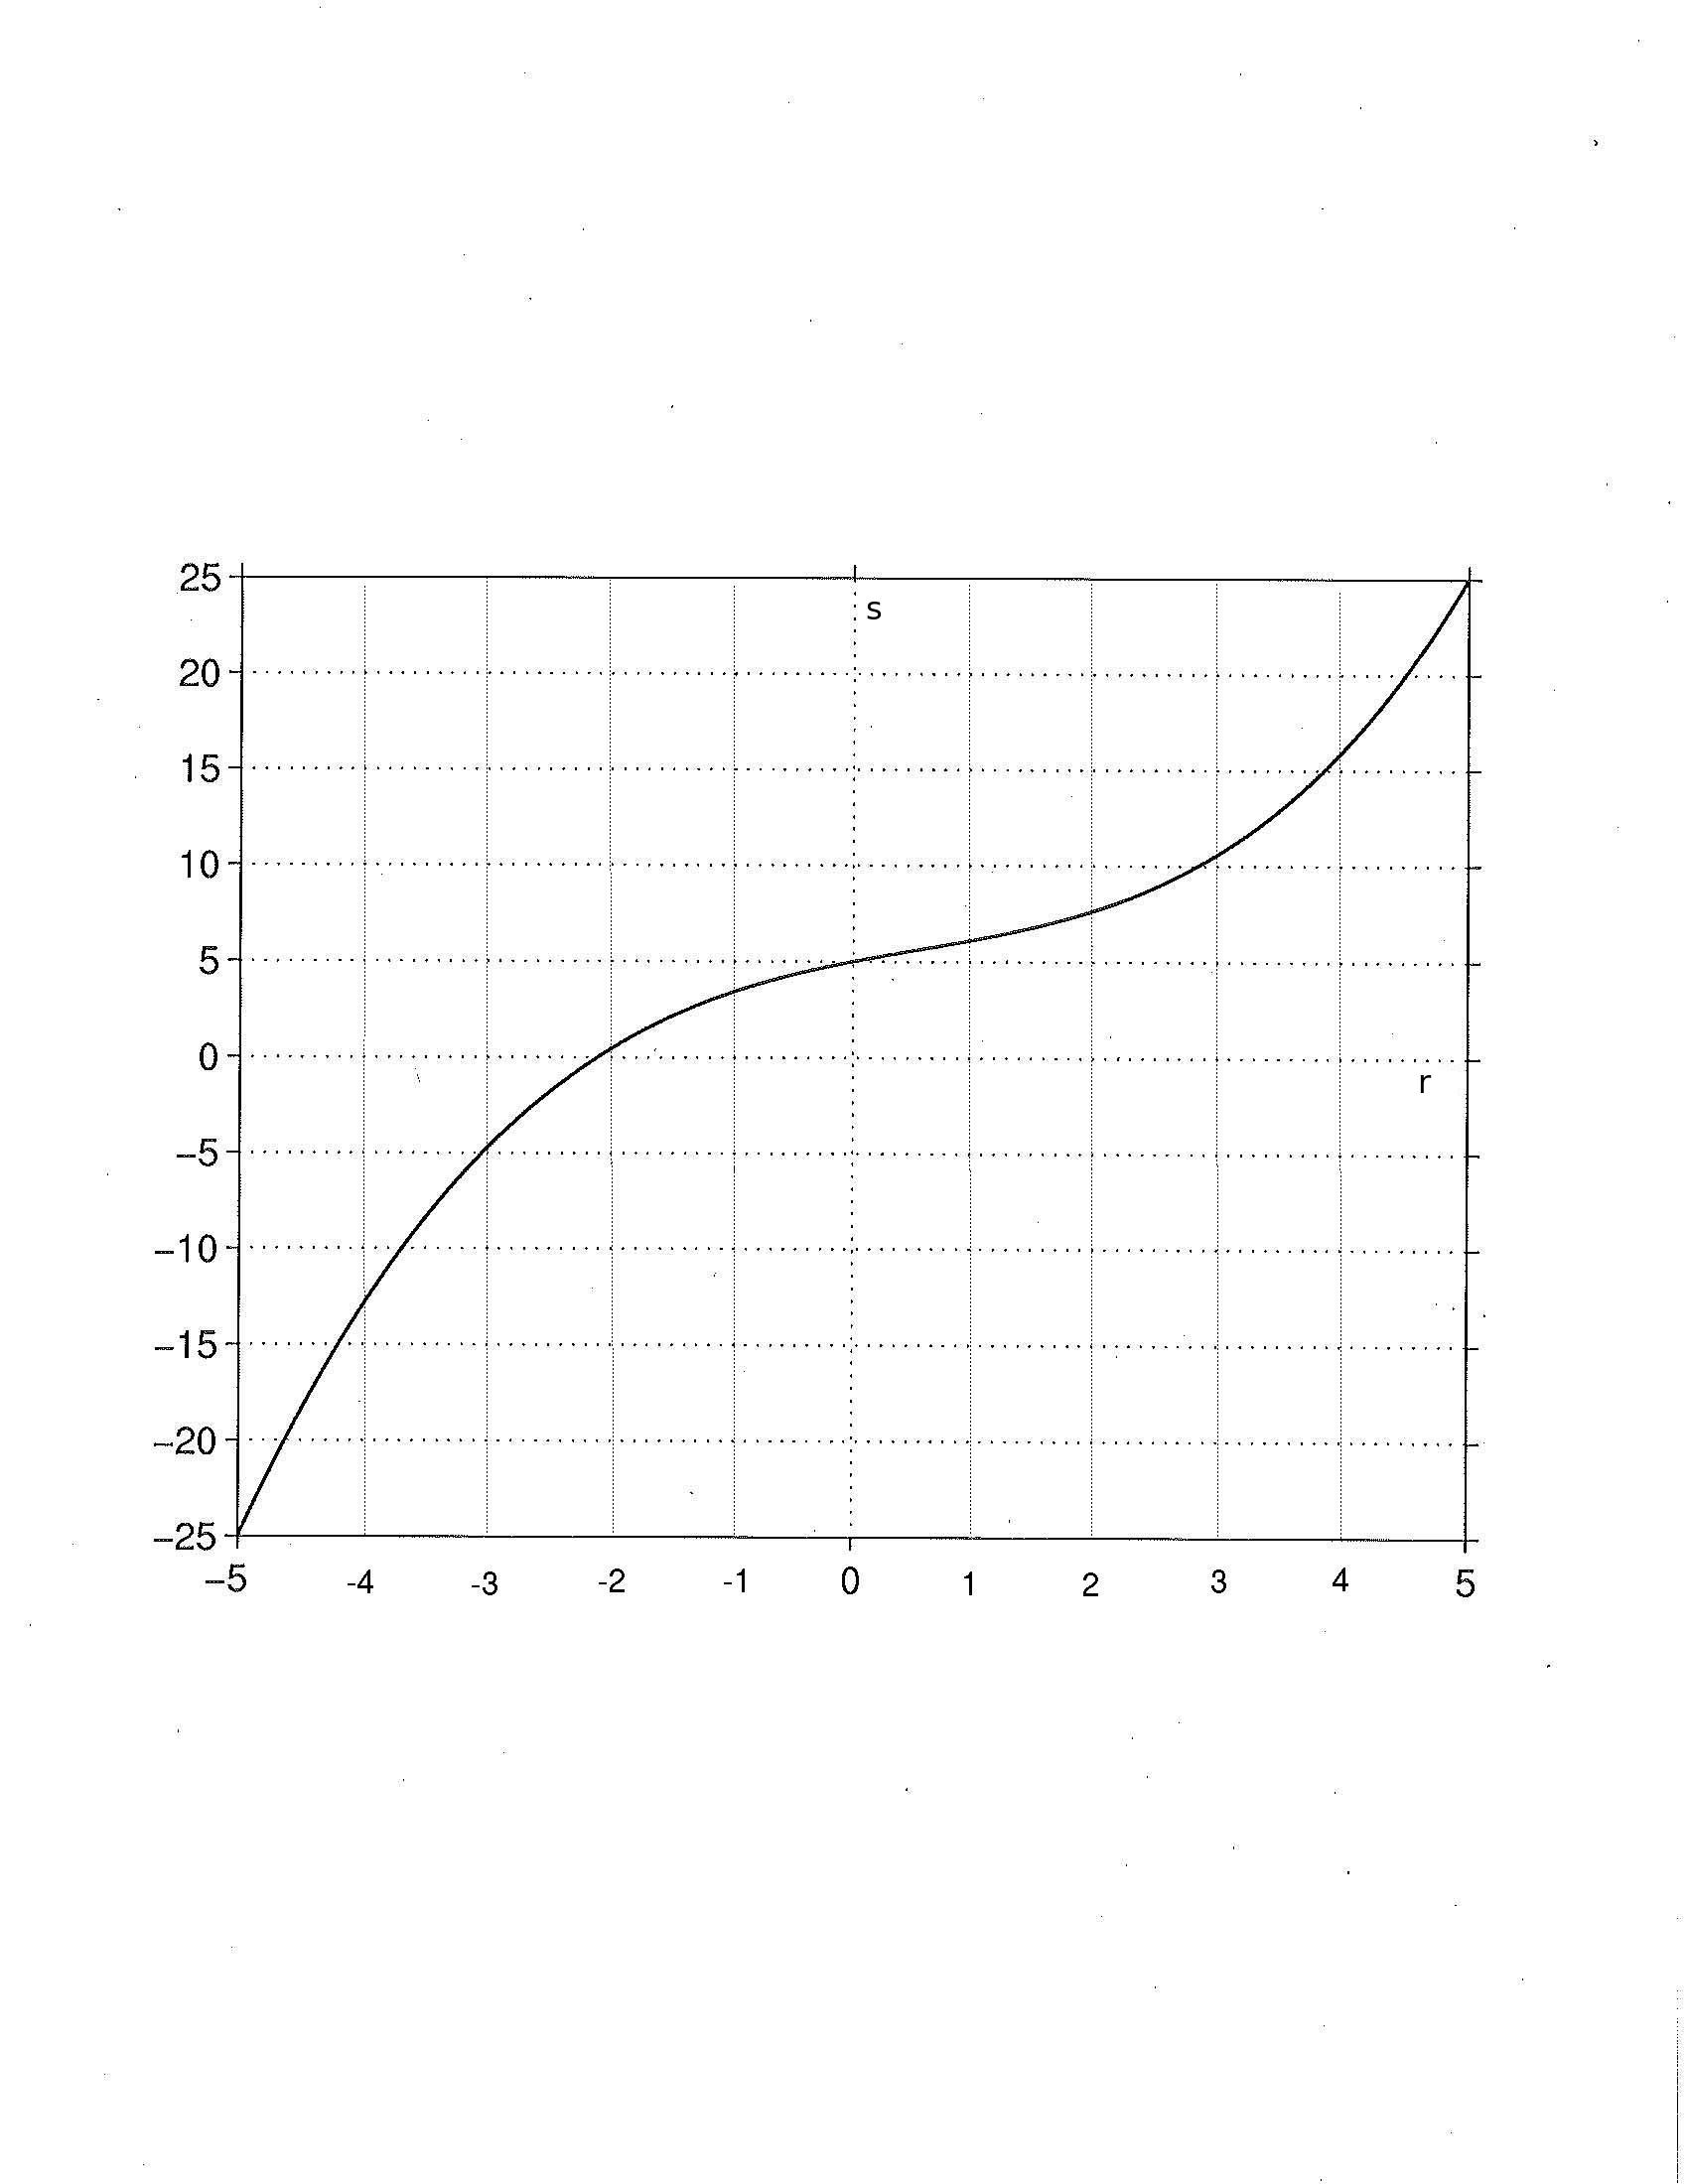
Consider the following graph for function s = f(r). (Click on the graph to obtain a clear version for printing.)
The first several questions relate to this function that has domain [-5, 5] and range [-25, 25]. Print out the graph to help determine your answers.
From the graph, estimate f(-3), f(0), and f(4).
Draw lines that approximate tangent lines to s=f(r) at r = -3, r = 0, and r = 4 .
Estimate the slope of each of the three lines from step 2.
Explain why function s = f(r) has an inverse r = f -1(s), and identify the domain and range of f -1(s).
Turn the printed graph over, trace the graph on this reverse side, rewrite the labels r and s on the proper axes, and label the points (s and r values) for the points identified in step 1.
Estimate f -1(-5), f -1(5), and f -1(16)
Draw lines that approximate tangent lines to r = f -1(s) at s = -5, s = 5, and s = 16 .
Estimate the slope of each of the three lines from step 7.
How are the slopes of the lines in step 2 related to the slopes of the lines in step 8? Write a paragraph that explains this relationship and why it occurs.
This part of the lab is optional and may be completed for extra credit.
The following materials examine the function s = tan r and its graph.
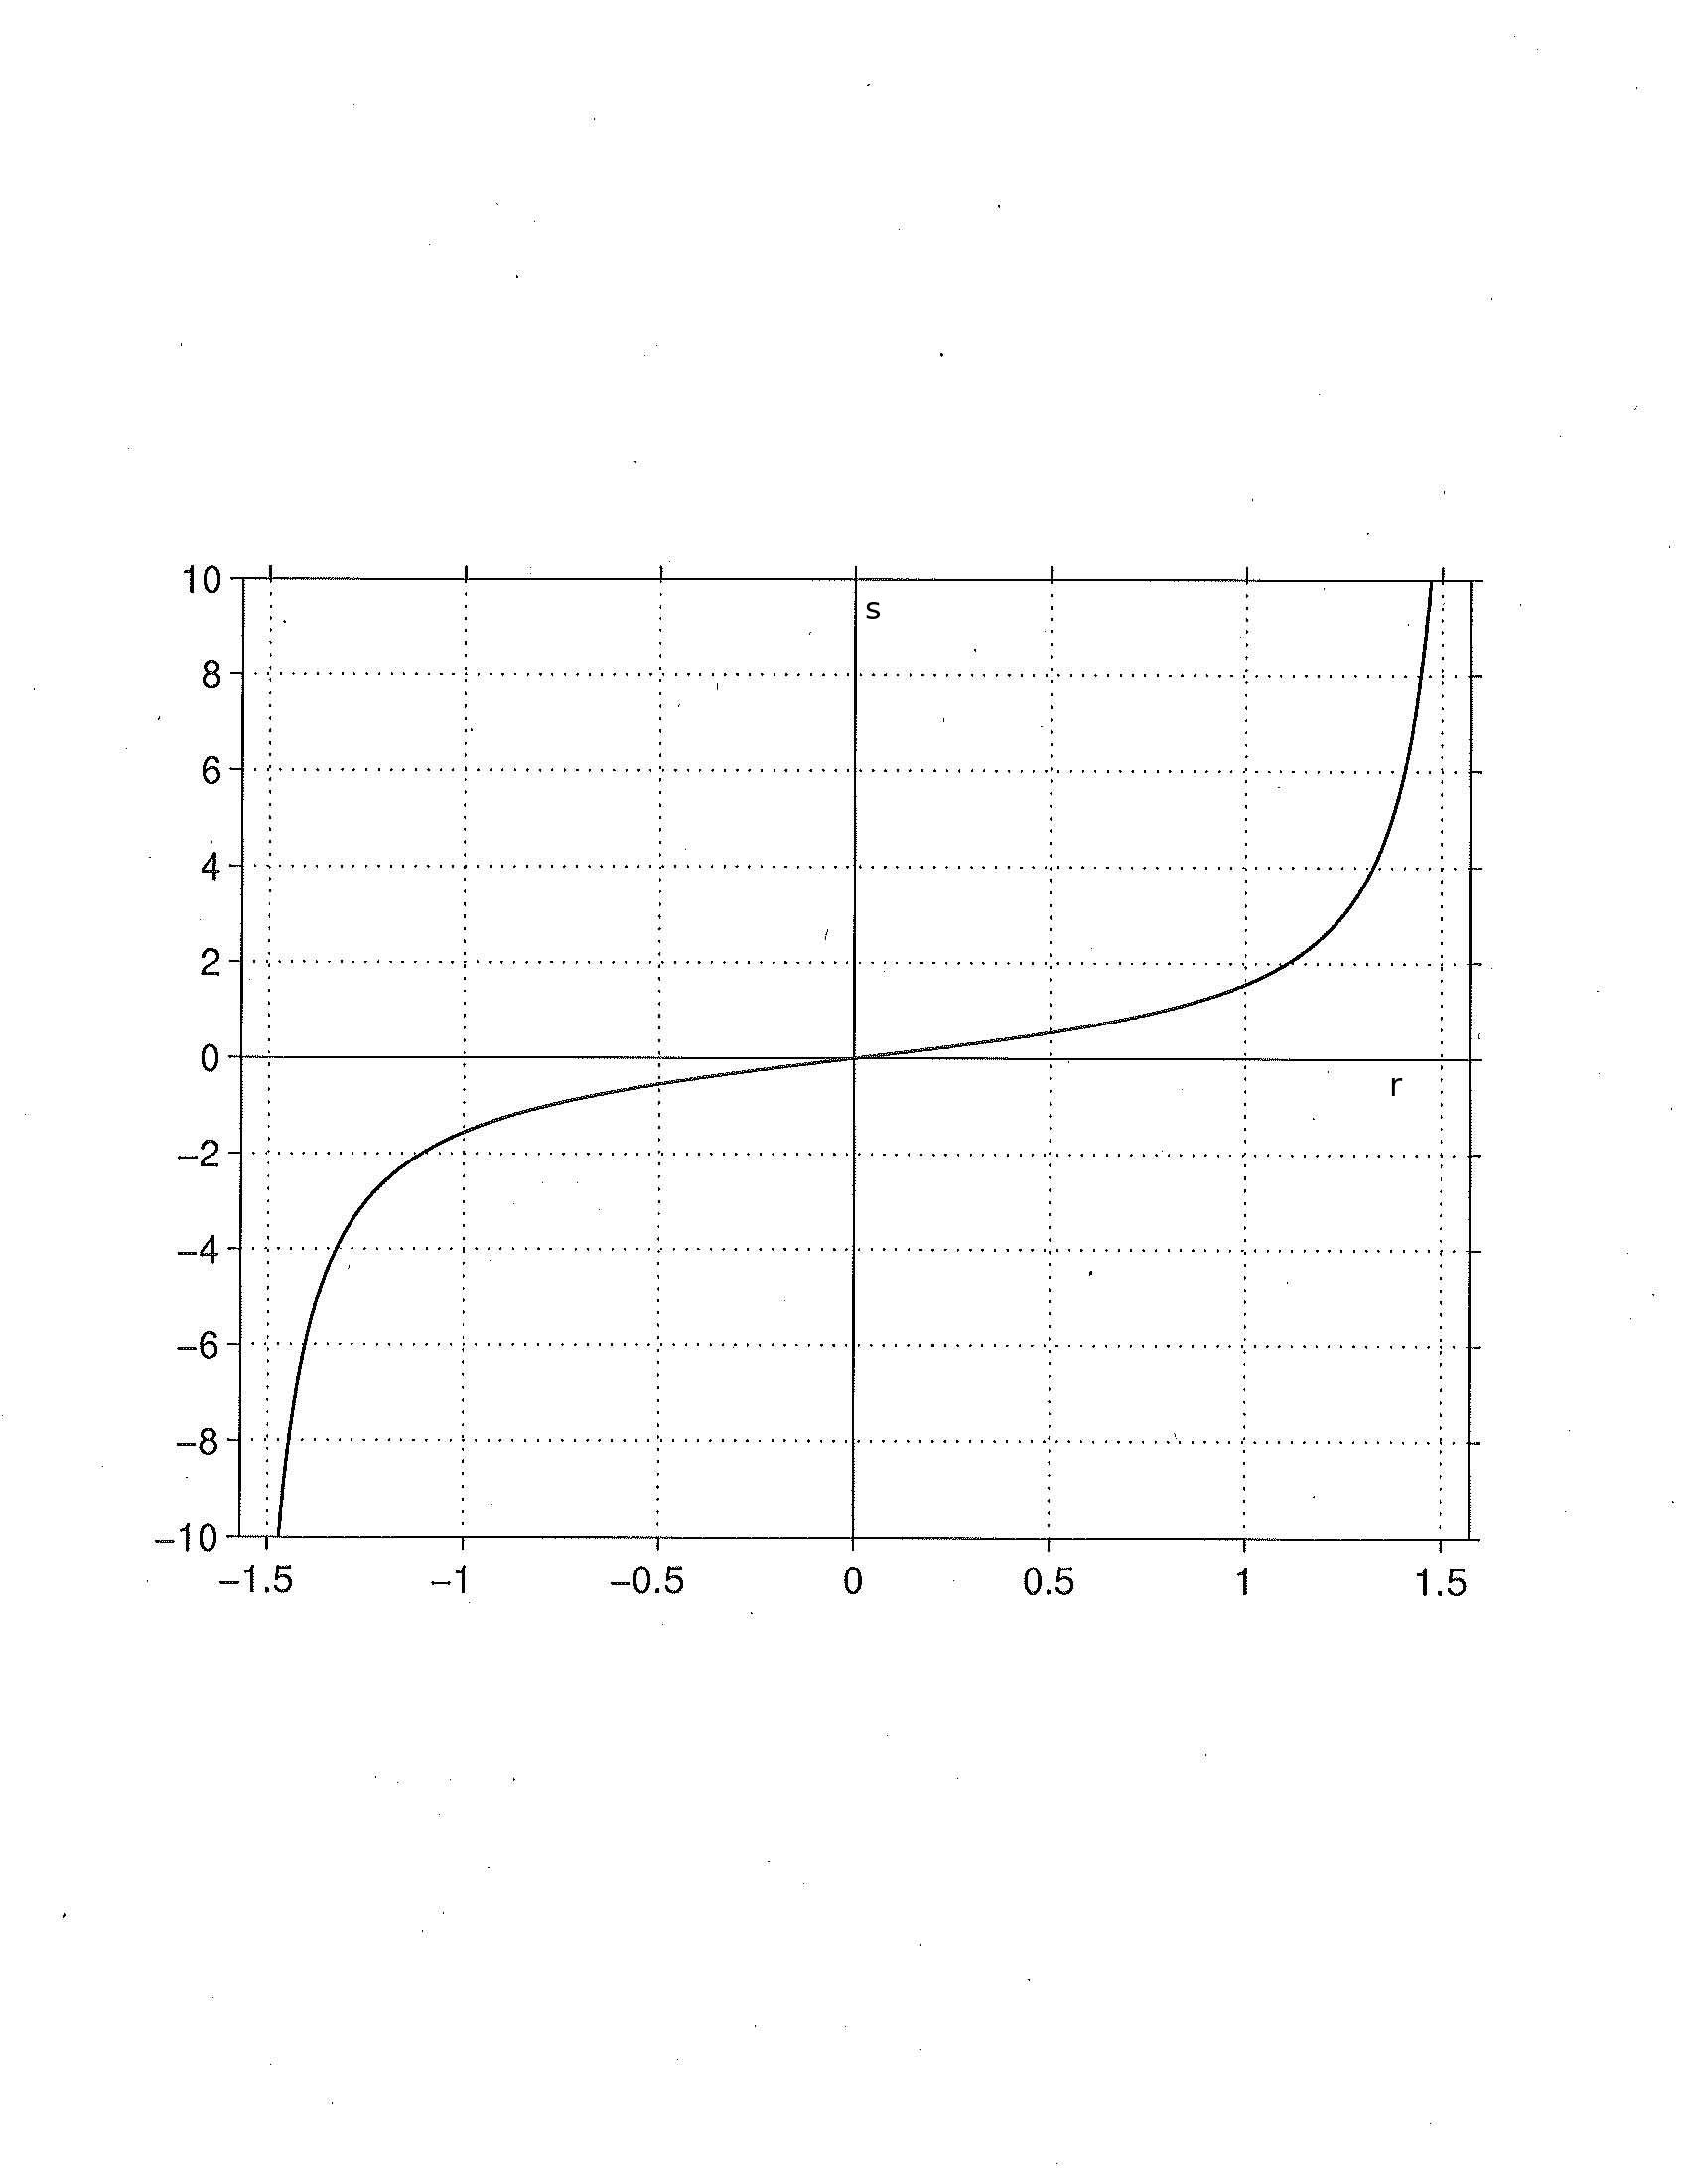
Explain why one must restrict the domain of r (traditionally to -π/2 ≤ r &le π/2), so that there will be an inverse function to s = tan r.
From the graph, estimate tan(-π/3), tan(0), and tan(π/4).
Draw lines that approximate tangent lines to s=tan(r) at r = -π/3, r = 0, and r = π/4. Then estimate the slope of each of these lines.
According to calculus, the derivative of s = tan r is sec 2(r). Compare the estimates of slope from step 13 with the corresponding values of sec 2(r).
Turn the printed graph over, trace the graph on this reverse side, rewrite the labels r and s on the proper axes, and label the points (s and r values) for the points identified in step 12.
Draw lines that approximate tangent lines at the points studied in steps 11 and 12; and estimate the slopes of these lines.
According to calculus, the derivative of r = tan -1(s) is 1 / (1 + s 2). Compare the estimates of slopes from step 13 with the corresponding values of 1 / (1 + s 2).
Describe how the slopes from steps 12 and 13 relate to the slopes obtained in steps 15 and 16, and explain why this relationship holds.
Steps 1-9 of this lab are required for this assignment.
Steps 10-17 of this lab may be done for extra credit (to be counted toward the lab grade).
This document is available on the World Wide Web as
http://www.walker.cs.grinnell.edu/courses/131.fa12/labs/inverse-func.shtml
|
created 28 November 2009 last revised 4 December 2009 |

|
| For more information, please contact Henry M. Walker at walker@cs.grinnell.edu. |